mls-stats
Python Streamlit App to generate quartlery real-estate statistic from MLS data.
Background
First things first, this isn’t my usual type of work. I built mls-stats as a fun side project for a family member who works in real-estate. Every quarter, he sends a booklet of recent real-estate statistics and trends in San Francisco to his clients. Unfortunately, getting these stats and graphs was getting too time consuming, so I built him an app to spit them out on demand!
What does it do?
Produce good-looking graphs and tables based on current MLS data in a format suitable for use in marketing materials.
More granularly, the app computes the following statistics:
- Average Sale Price
- Median Sale Price
- Average Price per Sq. Ft.
- Number of Sales
- Sale Price as a % of List Price
- Average Days on Market
- High Sale Price
- Number of Sales over Asking Price
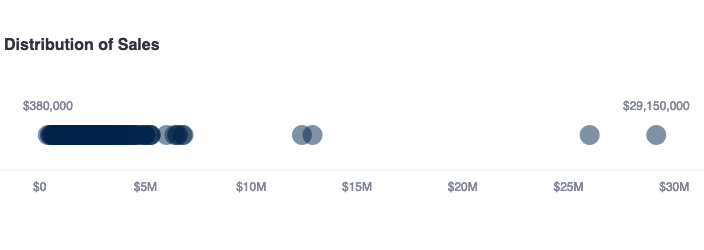
The app allows users to specify exactly what information they want in each graph and how it should be presented. Some graphs are simple, like the price distribution of homes sold for a given area and time period.

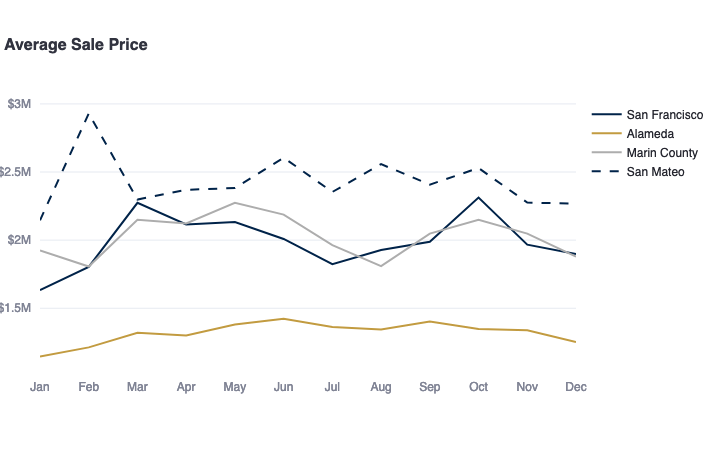
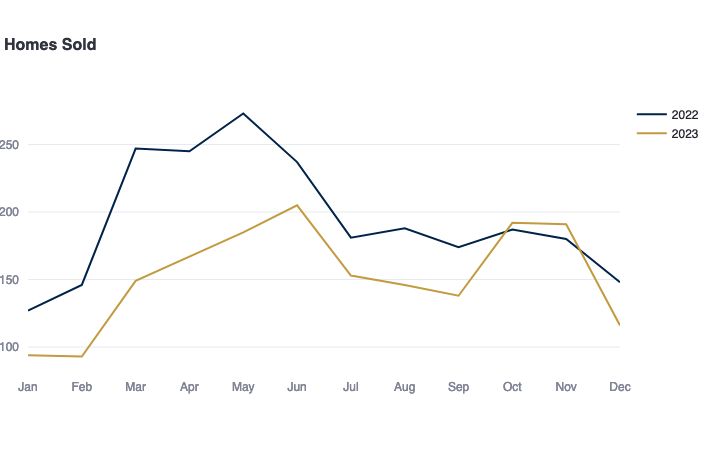
We can also get more detailed and compare statistics in different areas or time periods.


How does it work?
The mls-stats app has three main components:
- SQLite Database
- Streamlit User Interface
- Python app to interact with DB and compute statistics
SQLite Database
The database is fairly straightforward. It takes MLS data from a .csv file and creates an entry for each listing (indexed by listing number) which stores all the information we might need: sale price, list price, square footage, city, county, etc. Before insertion we also do some pre-processing like compute price per sq.ft. to reduce redundant calculations down the line.
Python App
The Python app does most of the heavy lifting:
- Interfaces with DB to create entries and execute queries
- Computes statistics (using pandas)
- Generates graphs (using plotly)
Streamlit UI
I’m not a front-end/UI developer, but I needed an easy to use interface for those in the real-estate office to use (my usual tactic of CLI wouldn’t cut it.) Thus, Streamlit. If you’re building a simple Python app and you want something more than a CLI or to share it across machines, I would recommend Streamlit.
It made it very easy to create a pretty interface without much heavy lifting on my part. It also allowed me to host the app remotely rather than install it on a single machine (and pray no one broke it).
Code
Unfortunately, the real version of the app must remain private due to the sensitive MLS data it contains. The code, however, is freely available on my GitHub.